NZD/USD Price Analysis: Pair tallied another daily loss, indicators show bearish outlook
- NZD/USD tumbled by 0.80% on Wednesday, currently trading around 0.5880.
- Pair continues moving towards August 5 lows around 0.5870.
- The RSI and the MACD both indicate that selling pressure is rising in the NZD/USD pair.
The NZD/USD pair extended its downtrend on Wednesday, declining by 0.8% to 0.5880, continuing its move towards the August 5 lows. The pair's overall momentum seems to be bearish, as indicated by both the Relative Strength Index (RSI) and the Moving Average Convergence Divergence (MACD).
The RSI, which measures overbought or oversold conditions, is around 33, indicating increasing selling pressure. The MACD, which measures trend strength and momentum, is red and rising, also suggesting a bearish outlook. The MACD histogram is also red and rising, further confirming the presence of the bearish forces. Although the RSI is currently oversold, which could potentially trigger a recovery, the overall technical outlook remains negative.
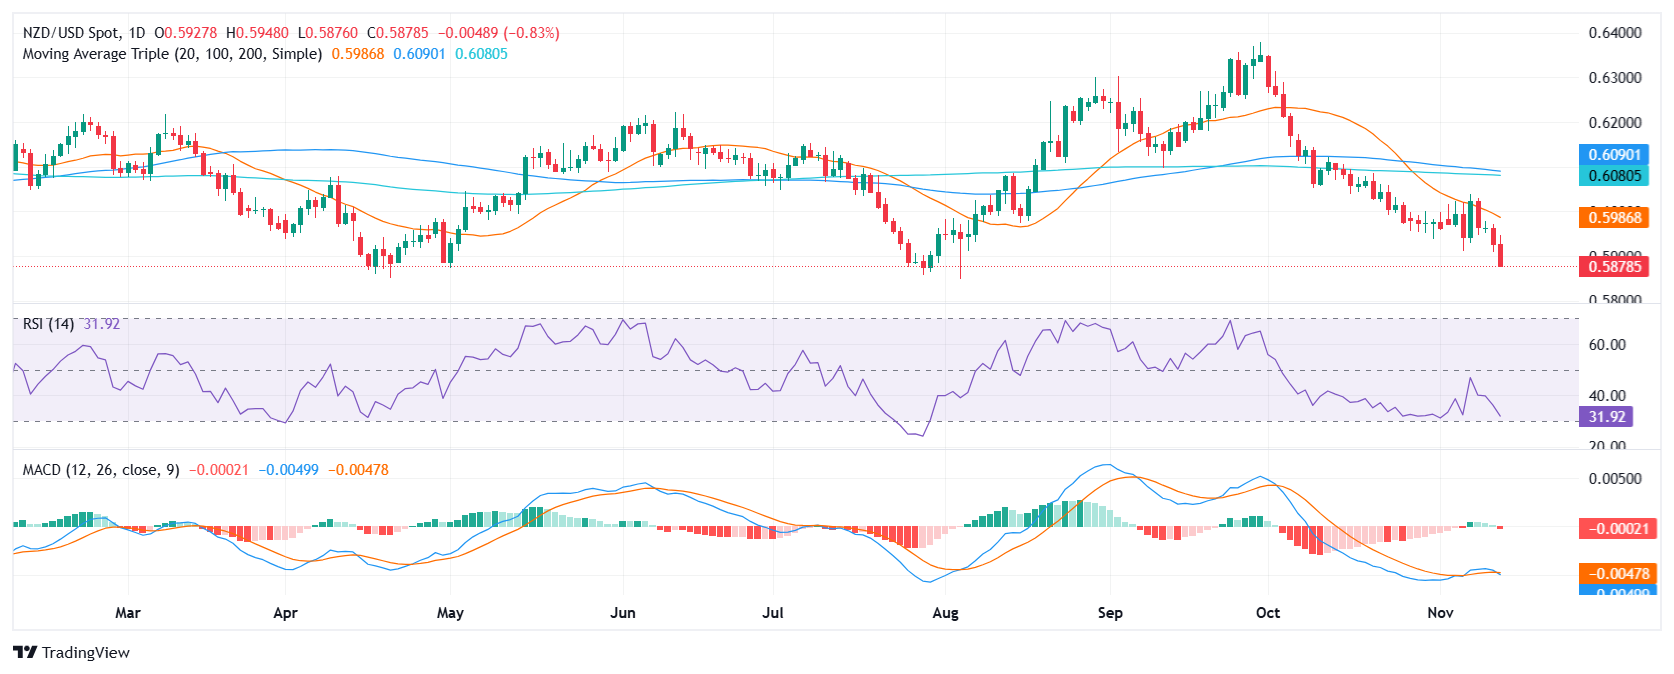
Resistance levels are seen at 0.5900, 0.5930, and 0.5950, and support levels at 0.5870, 0.5830, and 0.5815.
NZD/USD daily chart