NZD/USD Price Analysis: Bulls struggle to halt losing streak, hits lows in over a year
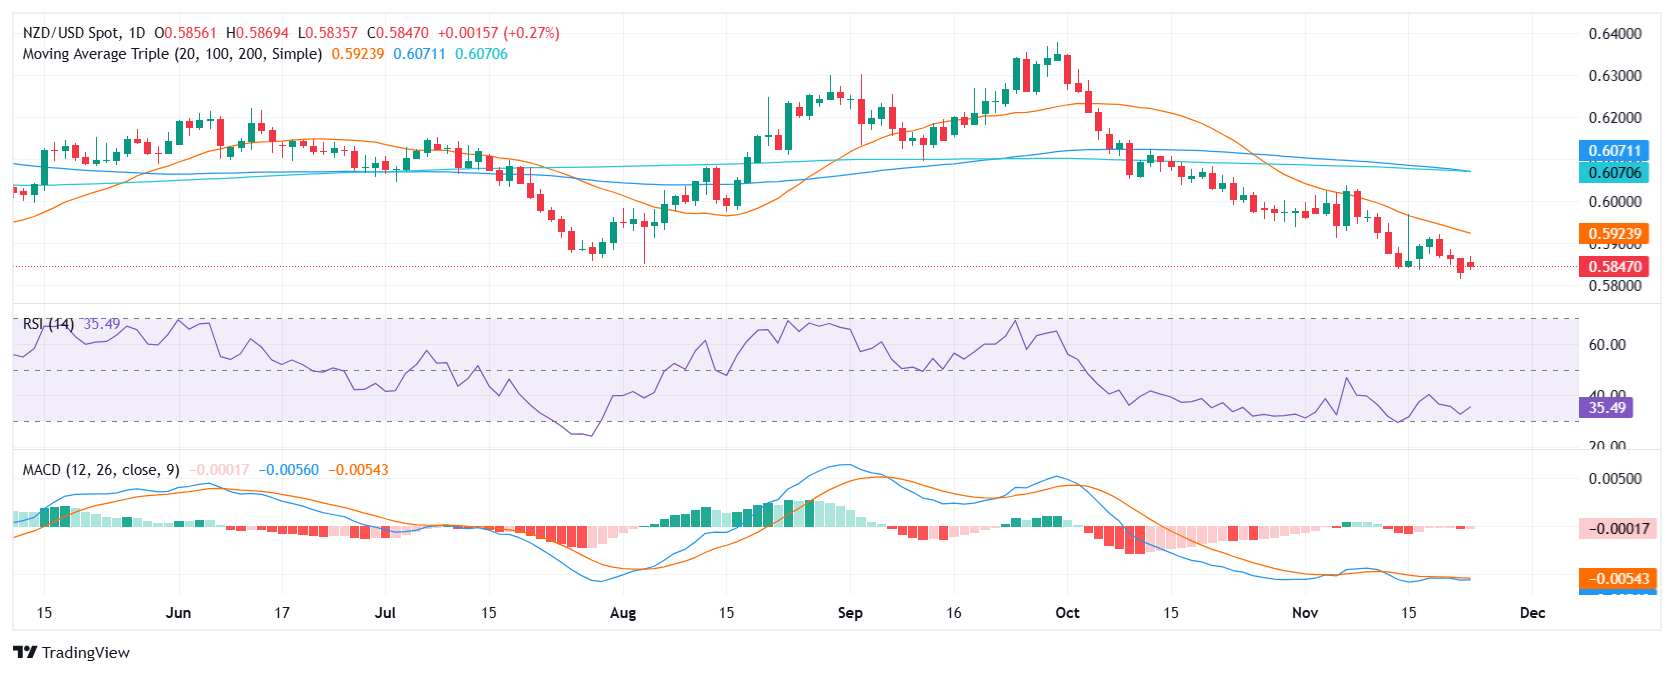
- NZD/USD staged minor losses on Monday and traded near 0.5850.
- Bulls struggle to halt losing streak, having tallied a four-day decline and reaching its lowest levels since November 2023.
- With oscillating signals from indicators, the NZD/USD may experience sideways trading in the near term.
The NZD/USD continued losing on Monday, to fall near 0.5850. Bulls struggle to halt the losing streak, now at lows since November 2023 but sellers might start to ran out of steam.
The pair's daily Relative Strength Index (RSI) is in the negative territory with a value of 37, indicating a strong selling pressure but its rising while the Moving Average Convergence Divergence (MACD) is flat and in red, reinforcing the bearish sentiment.
Despite the oscillating signals from the RSI and MACD, the overall momentum remains bearish. The pair is currently trading sideways within a range, with indicators emitting mixed signals. While the strong selling momentum may be waning, sellers still maintain the upper hand. Traders should monitor any break below the 0.5830 area which coil make the pair plunge towards 0.5800, while a break towards 0.5900 could be the trigger of a short-term recovery.
NZD/USD daily chart