GBP/USD slips to 10-week low as JOLTS miss offsets Fed caution
- GBP/USD trims losses as US JOLTS job openings drop to 7.437M in June, below 7.5M forecast.
- UK shop prices rise at fastest pace in over a year, signaling sticky inflation.
- BoE seen cutting rates next week with 83% probability amid weakening UK economy.
GBP/USD registers modest losses of over 0.10% on Tuesday after jobs data in the United States (US) showed signs of cooling, according to the Job Openings and Labor Turnover Survey (JOLTS). The Federal Reserve (Fed) has begun its two-day monetary policy meeting, which will end on July 30. The pair trades at 1.3337 after dropping to a 10-week low of 1.3307.
Cable dips to 1.3337 as US job openings shrink and UK inflation pressures persist ahead of key central bank decisions
The JOLTS report for June showed that vacancies fell from 7.769 million in May to 7.437 million in June, missing estimates of 7.5 million, according to the Bureau of Labor Statistics (BLS). Business reluctance to hire is due to uncertainty about tariff levels. The data comes ahead of the two-day meeting of the Fed, and of the Nonfarm Payrolls report for July, expected to show the economy added 102K jobs, below June’s 147K print.
Other data showed that Consumer Confidence improved according to the Conference Board in July. The index rose to 97.2, up from 93.0 in the previous month, exceeding forecasts of 95.0.
Across the pond, British shop prices rose the most in more than a year in July, an indication that inflation remains stickier than expected, as the economy begins to weaken. Ahead, the economic docket in the UK is light as traders await next week’s Bank of England (BoE) monetary policy announcement. The central bank is expected to cut rates by 25 basis points, with odds standing at 83%.
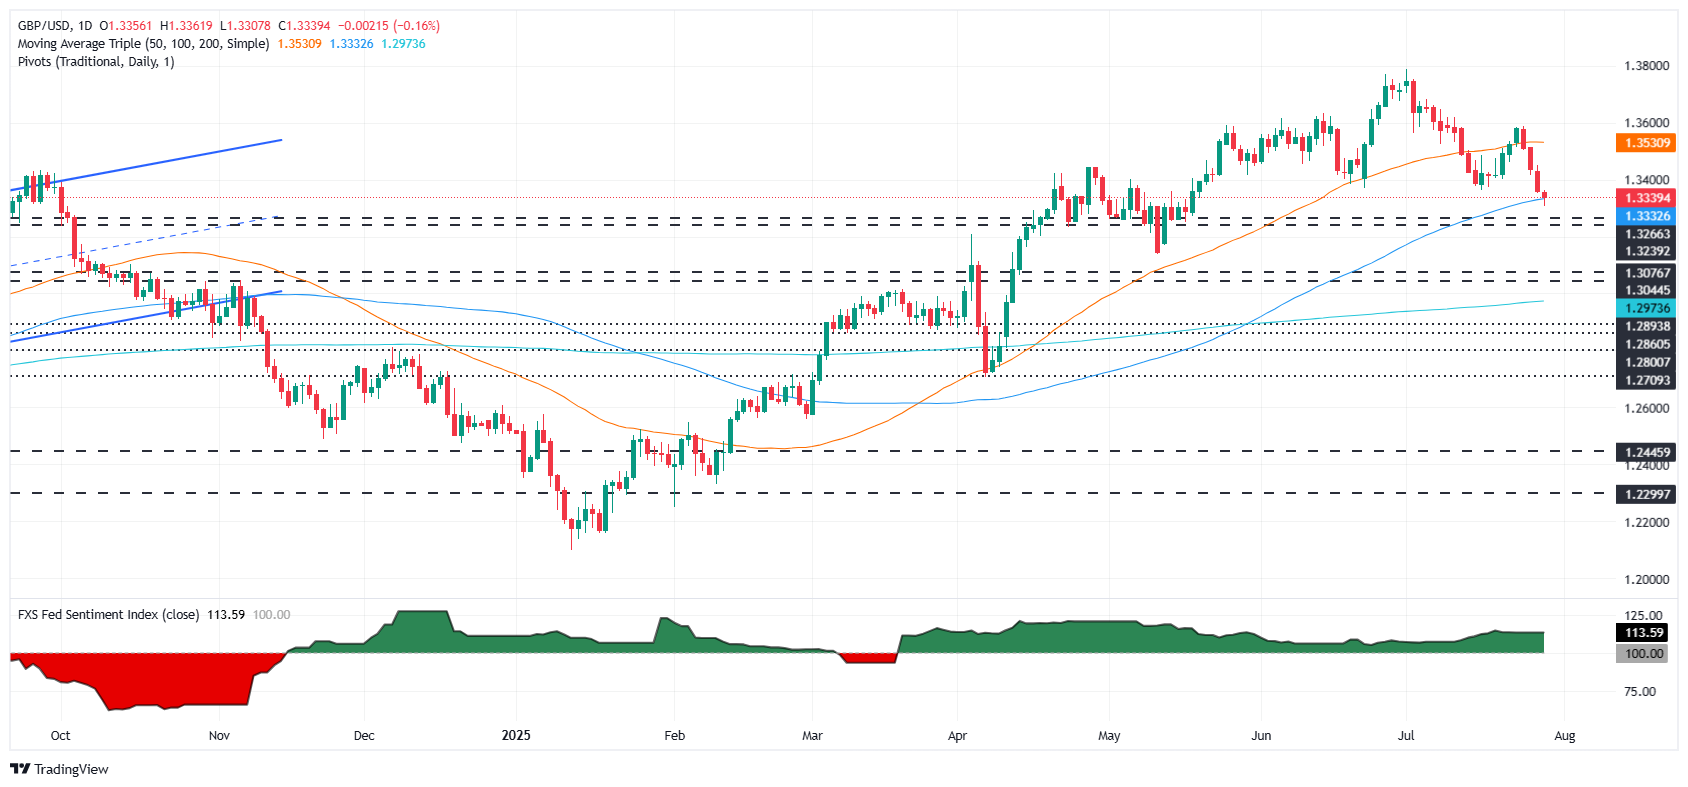
GBP/USD Price Forecast: Technical outlook
From a daily chart perspective, the pair is neutral to slightly tilted to the downside. The GBP/USD breached the June 23 low of 1.3369, exposing the 100-day SMA at 1.3329, which was briefly hurdled, before buyers stepped in, pushing prices higher.
Despite this, momentum remains bearish as the Relative Strength Index (RSI) fell below its neutral line. Therefore, if GBP/USD ends daily below 1.3350, expect a re-test of 1.3300 in the near term. Otherwise, buyers must clear 1.3400 if they would like to regain control and drive prices toward the 20-day SMA at 1.3501.
British Pound PRICE This week
The table below shows the percentage change of British Pound (GBP) against listed major currencies this week. British Pound was the strongest against the Euro.
| USD | EUR | GBP | JPY | CAD | AUD | NZD | CHF | |
|---|---|---|---|---|---|---|---|---|
| USD | 1.84% | 0.67% | 0.55% | 0.48% | 1.01% | 1.05% | 1.16% | |
| EUR | -1.84% | -1.18% | -1.25% | -1.35% | -0.81% | -0.78% | -0.67% | |
| GBP | -0.67% | 1.18% | -0.26% | -0.17% | 0.37% | 0.40% | 0.51% | |
| JPY | -0.55% | 1.25% | 0.26% | -0.07% | 0.42% | 0.48% | 0.75% | |
| CAD | -0.48% | 1.35% | 0.17% | 0.07% | 0.50% | 0.57% | 0.68% | |
| AUD | -1.01% | 0.81% | -0.37% | -0.42% | -0.50% | 0.03% | 0.13% | |
| NZD | -1.05% | 0.78% | -0.40% | -0.48% | -0.57% | -0.03% | 0.11% | |
| CHF | -1.16% | 0.67% | -0.51% | -0.75% | -0.68% | -0.13% | -0.11% |
The heat map shows percentage changes of major currencies against each other. The base currency is picked from the left column, while the quote currency is picked from the top row. For example, if you pick the British Pound from the left column and move along the horizontal line to the US Dollar, the percentage change displayed in the box will represent GBP (base)/USD (quote).