Dow Jones Industrial Average tests fresh highs on NFP beat despite downside revisions
- The Dow Jones tested 13-week highs on Friday after NFP jobs data beat the street.
- China approved rare earth exports to the US, bolstering trader hopes for a continued easing of tariffs.
- Key US inflation data coming up next week, tariff impacts due to begin leaking into headline data.
The Dow Jones Industrial Average (DJIA) briefly tested fresh 13-week peaks on Friday, with equities taking a step higher after Nonfarm Payrolls (NFP) jobs data came in stronger than expected. Trade tensions, or at least market perception of them, are also easing, keeping major indexes broadly bolstered to wrap up an otherwise middling trading week.
NFP net job gains were stronger than expected in May, showing an overall gain of 139K new payroll positions, beating the expected print of 130K. The figure is still down from April’s 147K, which was revised sharply lower after the Bureau of Labor Statistics (BLS) was forced to fix a data calculation error.
China caved to mounting pressure from the Trump administration on Friday, approving a batch of export licenses for rare earth dealers that supply critical minerals to the American automotive industry. President Trump and Chinese President Xi Jinping went tit-for-tat on accusations of violating early trade agreement terms last week.
Major indexes were further supported by a sharp recovery in Tesla (TSLA) shares, which took a hard hit this week as a very public fallout between President Trump and his former right-hand man, Elon Musk, boils over. Tesla shares plunged below $275 per share overnight before a sharp recovery back above $300 per share early on Friday. General tech stocks, including Nvidia (NVDA), Apple (AAPL), and Meta Platforms (META) all traded higher on Friday as general sentiment in the AI-fueled tech rally continues to lean into hopes that Trump’s anti-China stance on tech trade will be tempered over time.
Read more stock news: S&P 500 reaches 6,000 for first time since February on NFP print
Headline Consumer Price Index (CPI) inflation figures for May are due next week. Investors will be pivoting to face the first batch of inflation data that will include initial price volatility from the Trump administration’s whiplash tariff moves in April. Annualized headline CPI inflation is expected to rise to 2.5% YoY from 2.3%, and core CPI inflation measures are forecast to tick up to 2.9% from 2.8%.
Dow Jones price forecast
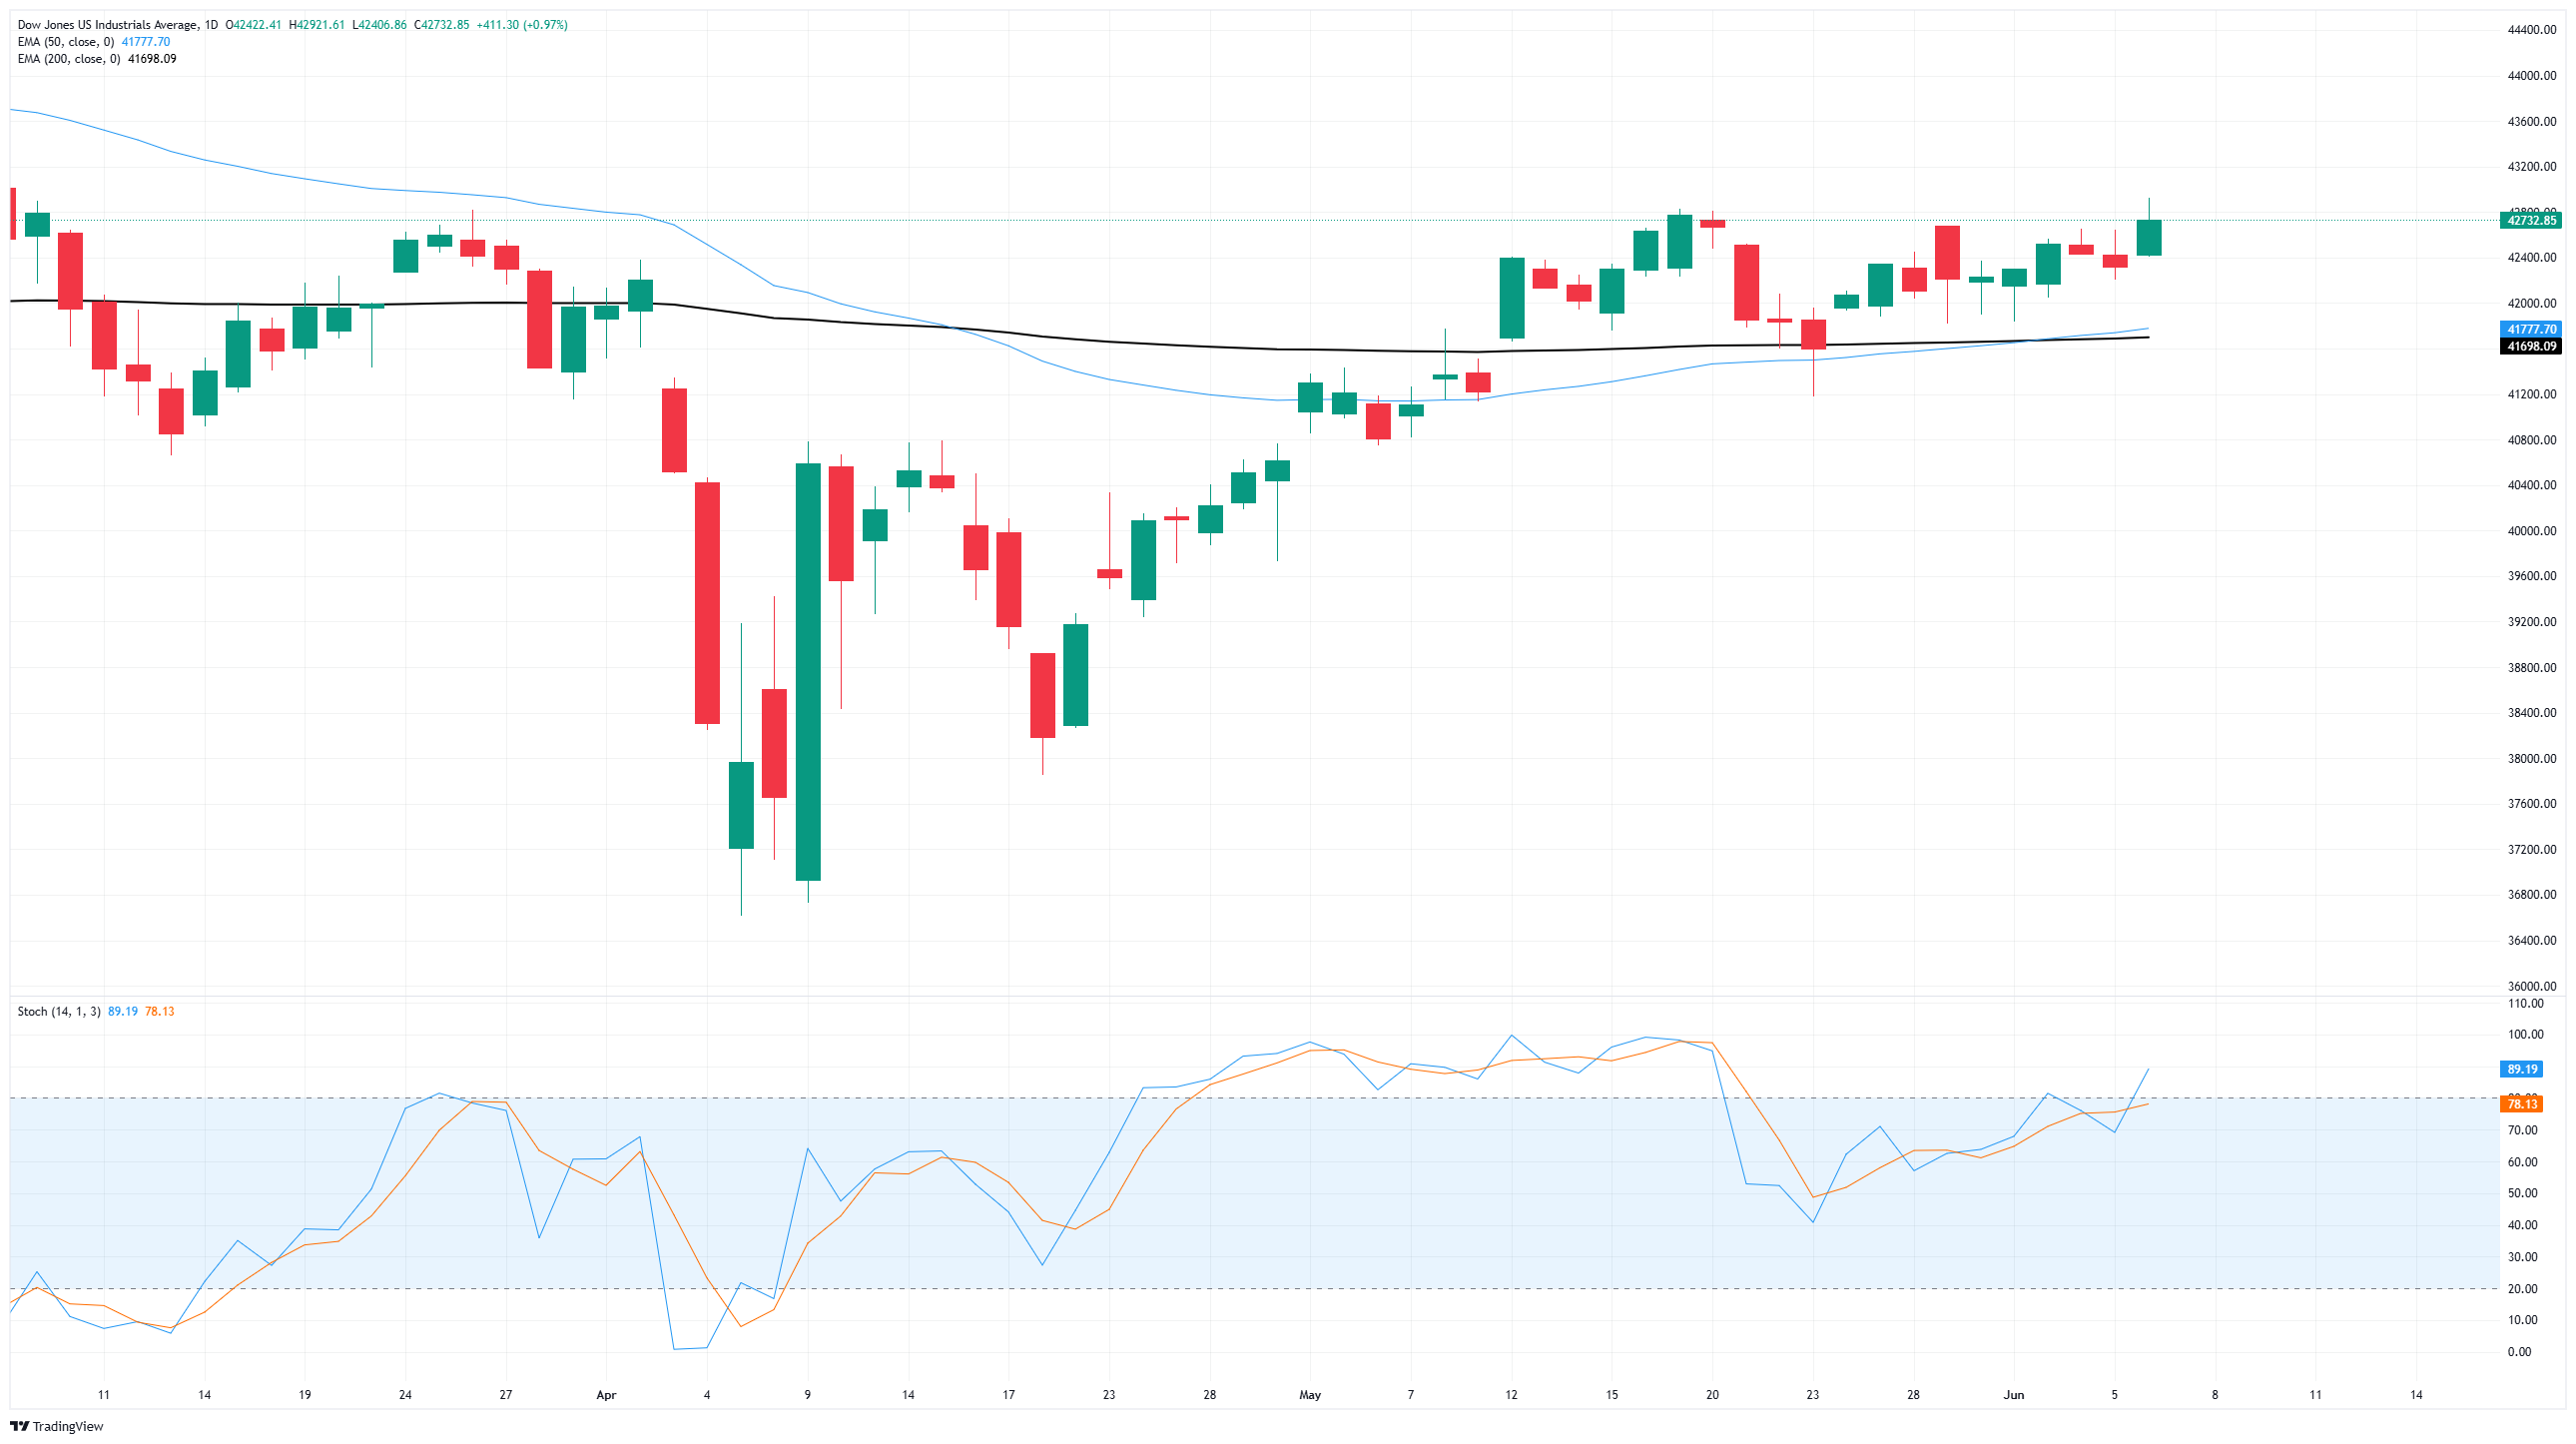
Despite testing a 13-week intraday high on Friday, Dow Jones bids remain trapped in near-term consolidation. The major equity index is adrift in a messy range between 42,800 and 41,200, with price action churning chart paper just above the 200-day Exponential Moving Average (EMA) near 41,640.
Dow Jones daily chart
Dow Jones FAQs
The Dow Jones Industrial Average, one of the oldest stock market indices in the world, is compiled of the 30 most traded stocks in the US. The index is price-weighted rather than weighted by capitalization. It is calculated by summing the prices of the constituent stocks and dividing them by a factor, currently 0.152. The index was founded by Charles Dow, who also founded the Wall Street Journal. In later years it has been criticized for not being broadly representative enough because it only tracks 30 conglomerates, unlike broader indices such as the S&P 500.
Many different factors drive the Dow Jones Industrial Average (DJIA). The aggregate performance of the component companies revealed in quarterly company earnings reports is the main one. US and global macroeconomic data also contributes as it impacts on investor sentiment. The level of interest rates, set by the Federal Reserve (Fed), also influences the DJIA as it affects the cost of credit, on which many corporations are heavily reliant. Therefore, inflation can be a major driver as well as other metrics which impact the Fed decisions.
Dow Theory is a method for identifying the primary trend of the stock market developed by Charles Dow. A key step is to compare the direction of the Dow Jones Industrial Average (DJIA) and the Dow Jones Transportation Average (DJTA) and only follow trends where both are moving in the same direction. Volume is a confirmatory criteria. The theory uses elements of peak and trough analysis. Dow’s theory posits three trend phases: accumulation, when smart money starts buying or selling; public participation, when the wider public joins in; and distribution, when the smart money exits.
There are a number of ways to trade the DJIA. One is to use ETFs which allow investors to trade the DJIA as a single security, rather than having to buy shares in all 30 constituent companies. A leading example is the SPDR Dow Jones Industrial Average ETF (DIA). DJIA futures contracts enable traders to speculate on the future value of the index and Options provide the right, but not the obligation, to buy or sell the index at a predetermined price in the future. Mutual funds enable investors to buy a share of a diversified portfolio of DJIA stocks thus providing exposure to the overall index.